Visual Analytics Project
Research Paper
Research Paper for "DEGGED - Dynamic Exploration of Greenhouse Gas Emissions and its Determinants using R and Shiny"
Poster
Poster for "DEGGED - Dynamic Exploration of Greenhouse Gas Emissions and its Determinants using R and Shiny"
DEGGED: Shiny Application
Dynamic Exploration of Greenhouse Gas Emissions and its Determinants using R and Shiny, DEGGED in short, is a web-enabled client-based analytics tool built on R Shiny that allows users to perform exploratory data analysis, ordinary least squares regression and panel data regression to examine the relationship between drivers and mitigation measures with greenhouse gas emission levels.
Determining the Drivers of Greenhouse Gas Emissions for European Countries using Panel Data Analysis
This post details the preliminary investigation on the drivers of greenhouse gas emissions in European countries through the use of panel data analysis in R. The assignment is part of the Shiny-based Visual Analytics Application project undertaken for the course of ISSS608 Visual Analytics and Applications offered by SMU MITB.
Estimating the relationship of determinants and Greenhouse Gas Emission levels using Ordinary Least Square Regression
The write-up below details the steps taken to explore the different packages available to perform Ordinary Least Square regression model to estimate the relationship of determinants and Greenhouse gas emission levels. This is part of the project deliverables for a project undertaken for the course ISSS608- Visual Analytics offered in SMU MITB.
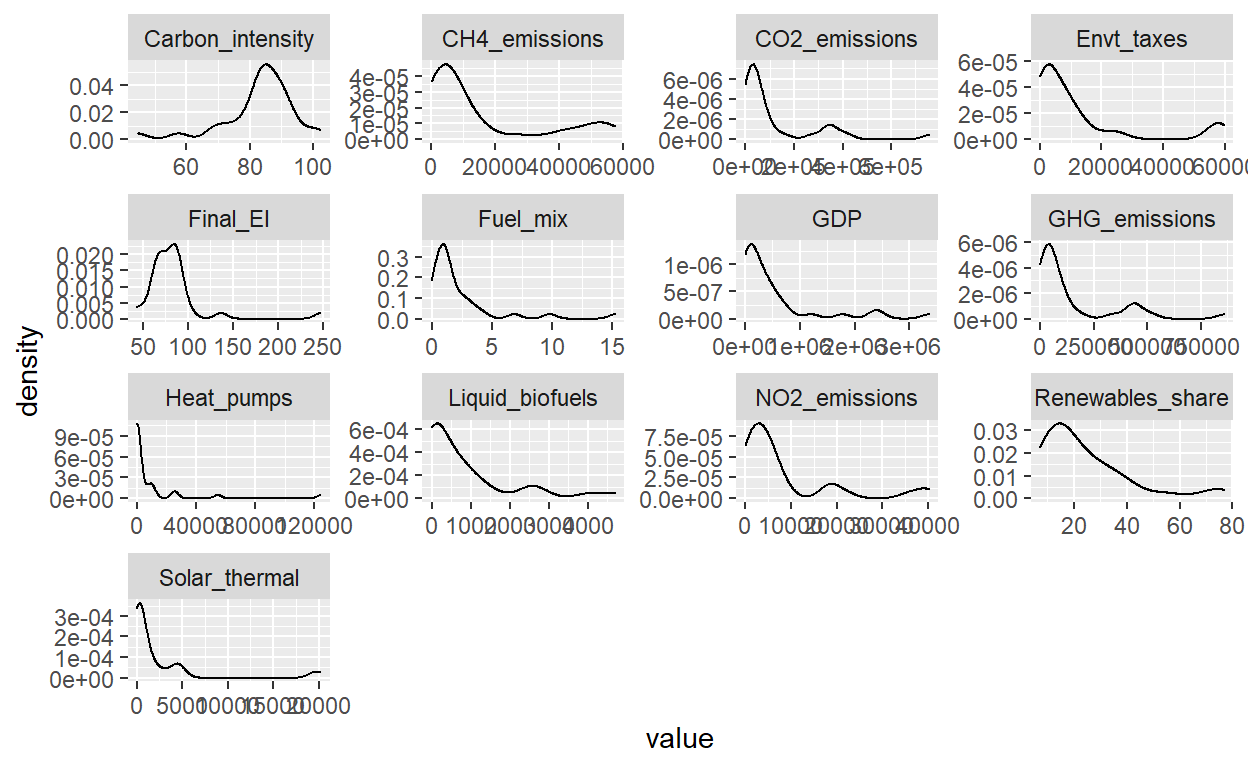
Exploration Data Analysis of factors affecting Greenhouse Gas Emission levels
Individual assignment for the visual analytics project.
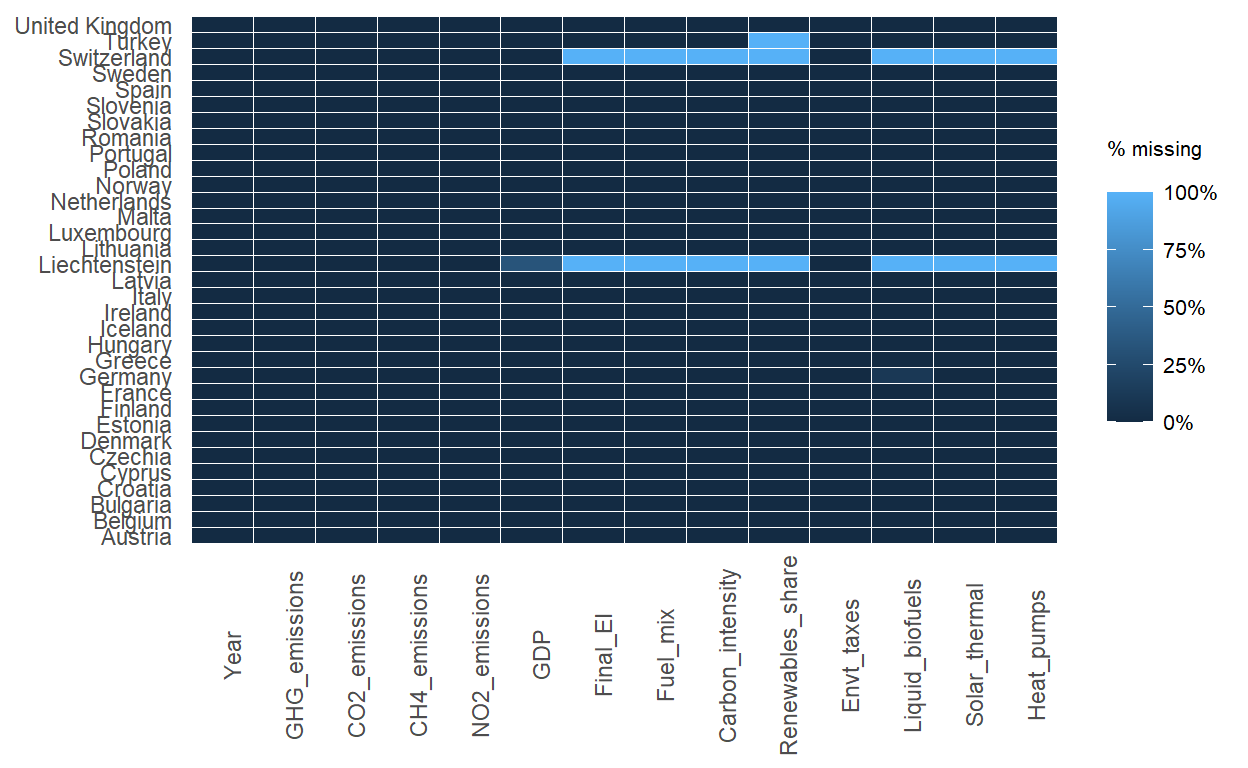
Data Preparation
Details on the data source and the step-by-step guide for data manipulation to merge all datasets into 1 consolidated data for subsquent analyses
Project Proposal
Exploring the relationship of drivers and mitigation measures with greenhouse gas emissions for European Union countries through exploratory data analysis and advanced statistical techniques namely Ordinary Least Square (OLS) Regression and Panel Data Regresion
Welcome to Visual Analytics Project
Welcome to our new blog, Visual Analytics Project. We hope you enjoy reading what we have to say!